
// CASE STUDY · PRODUCT
CVDPREVENT
Turning complex national clinical data into a usable digital product.
- Product design
- Data visualisation
- Front-end development
 (opens in a new tab)
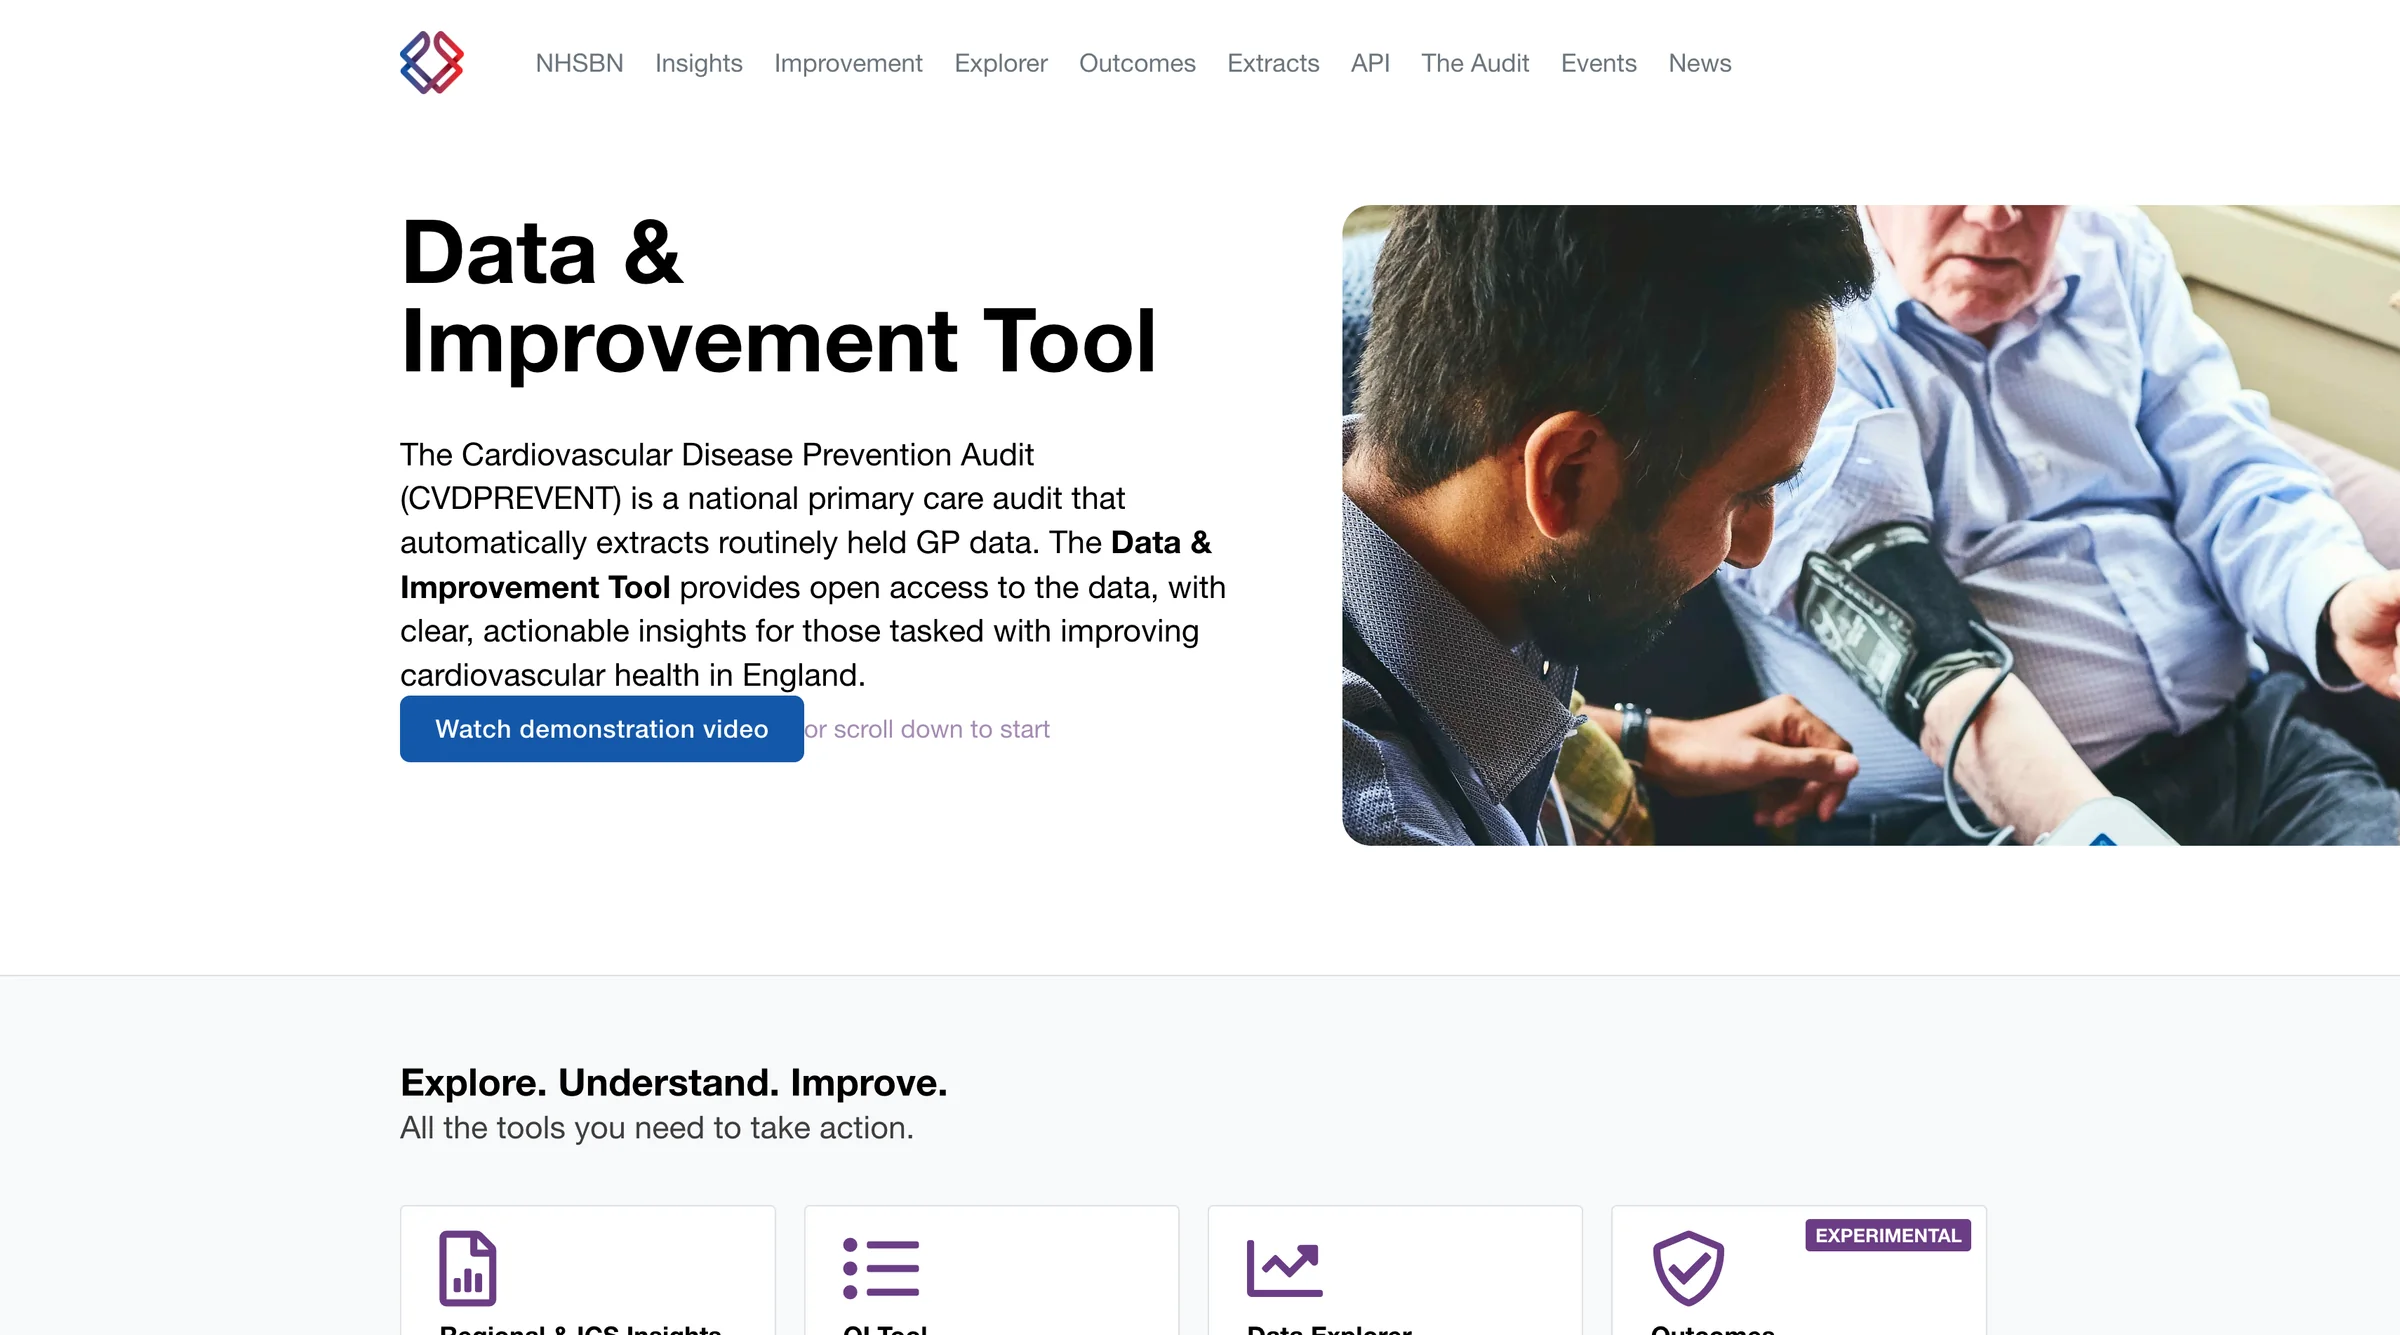
CVDPREVENT is a national cardiovascular disease prevention audit, commissioned by the Healthcare Quality Improvement Partnership (HQIP). Its public-facing data platform helps NHS professionals, analysts and other audiences explore cardiovascular indicators across England.
It was a substantial team and programme effort. My particular contribution was connecting the analytical requirements, stakeholder needs, product design and front-end implementation.
The challenge
The programme needed to make a vast and complex dataset useful to very different audiences.
The underlying patient-level source data contained hundreds of millions of rows, with coverage across GP practices throughout England. Users needed to explore aggregated indicators across different geographical levels, from individual practices to national comparisons, and examine inequalities relating to ethnicity, sex and deprivation.
Early work had explored Power BI, but the scale of the data, licensing considerations and the need for a tailored public experience presented significant challenges.
The requirement was for more than a conventional dashboard. It needed to become a coherent, understandable digital product.
Shaping the product
My initial involvement was to help establish how the data platform should look and work. That quickly developed into a wider responsibility for leading product definition and design, and personally developing the complete Angular front end.
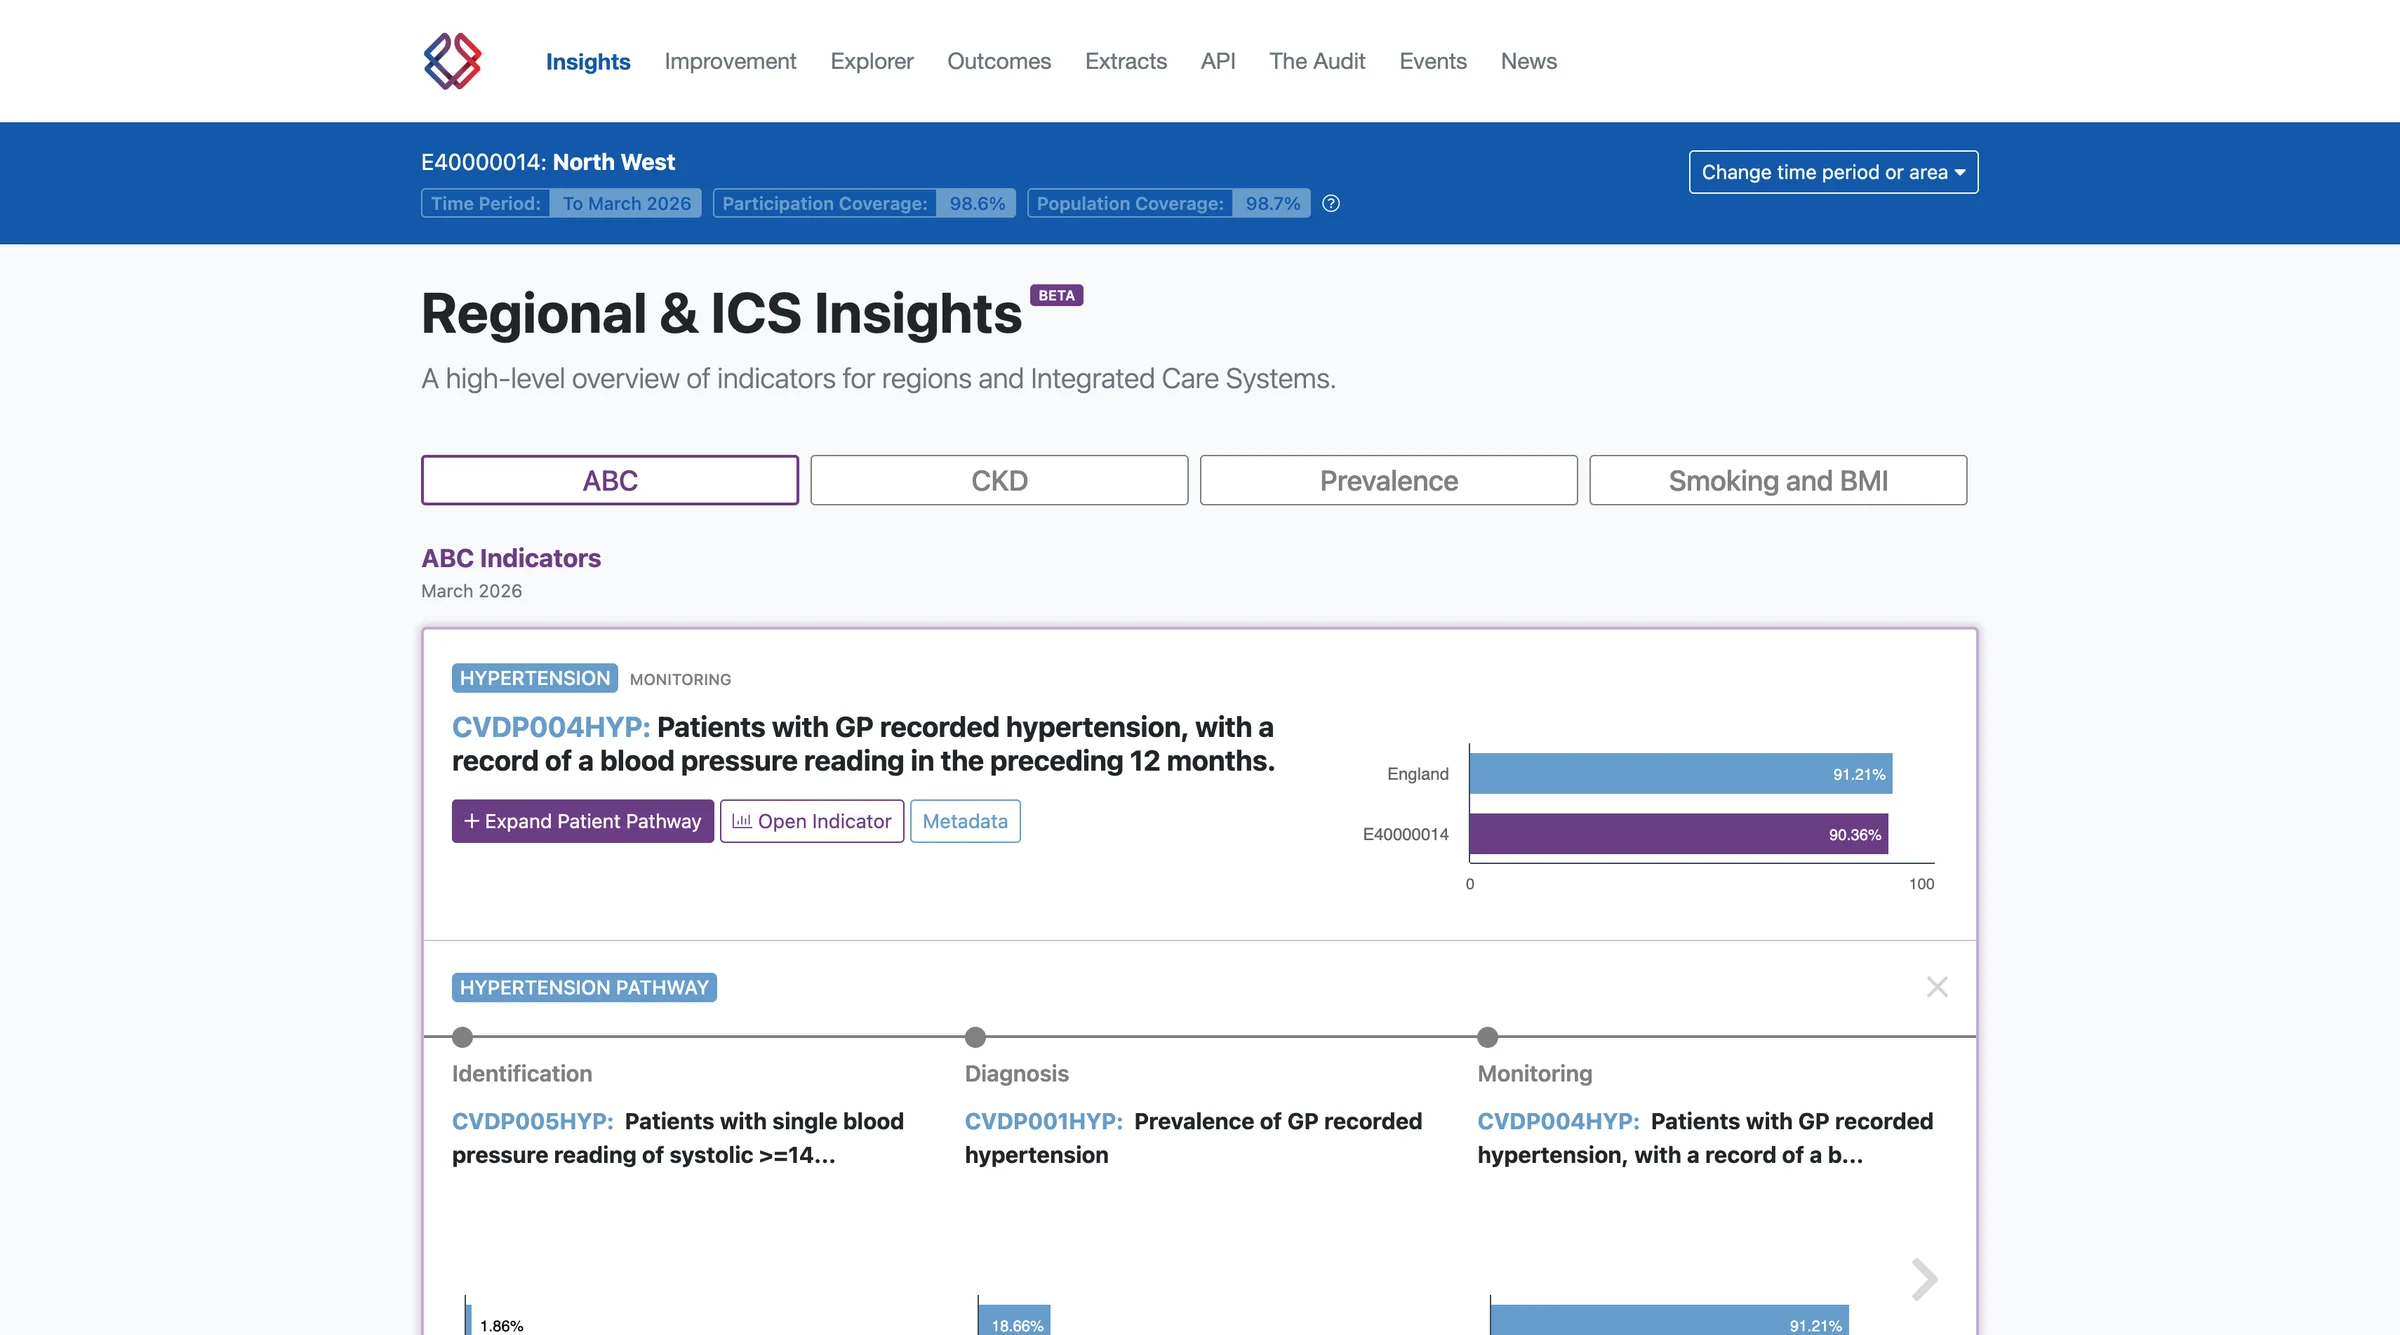
I worked with programme stakeholders, including OHID and HQIP, to understand analytical requirements and help shape how the underlying data could be aggregated and presented.
This involved translating complex clinical and analytical needs into practical user journeys, developing an early working prototype, and iterating the design through discussions with clinicians, analysts and senior NHS stakeholders.
The objective was to make sophisticated information understandable and useful without removing the depth needed by specialist audiences.
 (opens in a new tab)
From concept to delivery
Alongside product definition, I created the CVDPREVENT visual identity and designed the interface and data visualisations.
I then developed the complete Angular front end, working closely with a separate back-end developer responsible for the Python API and SQL database.
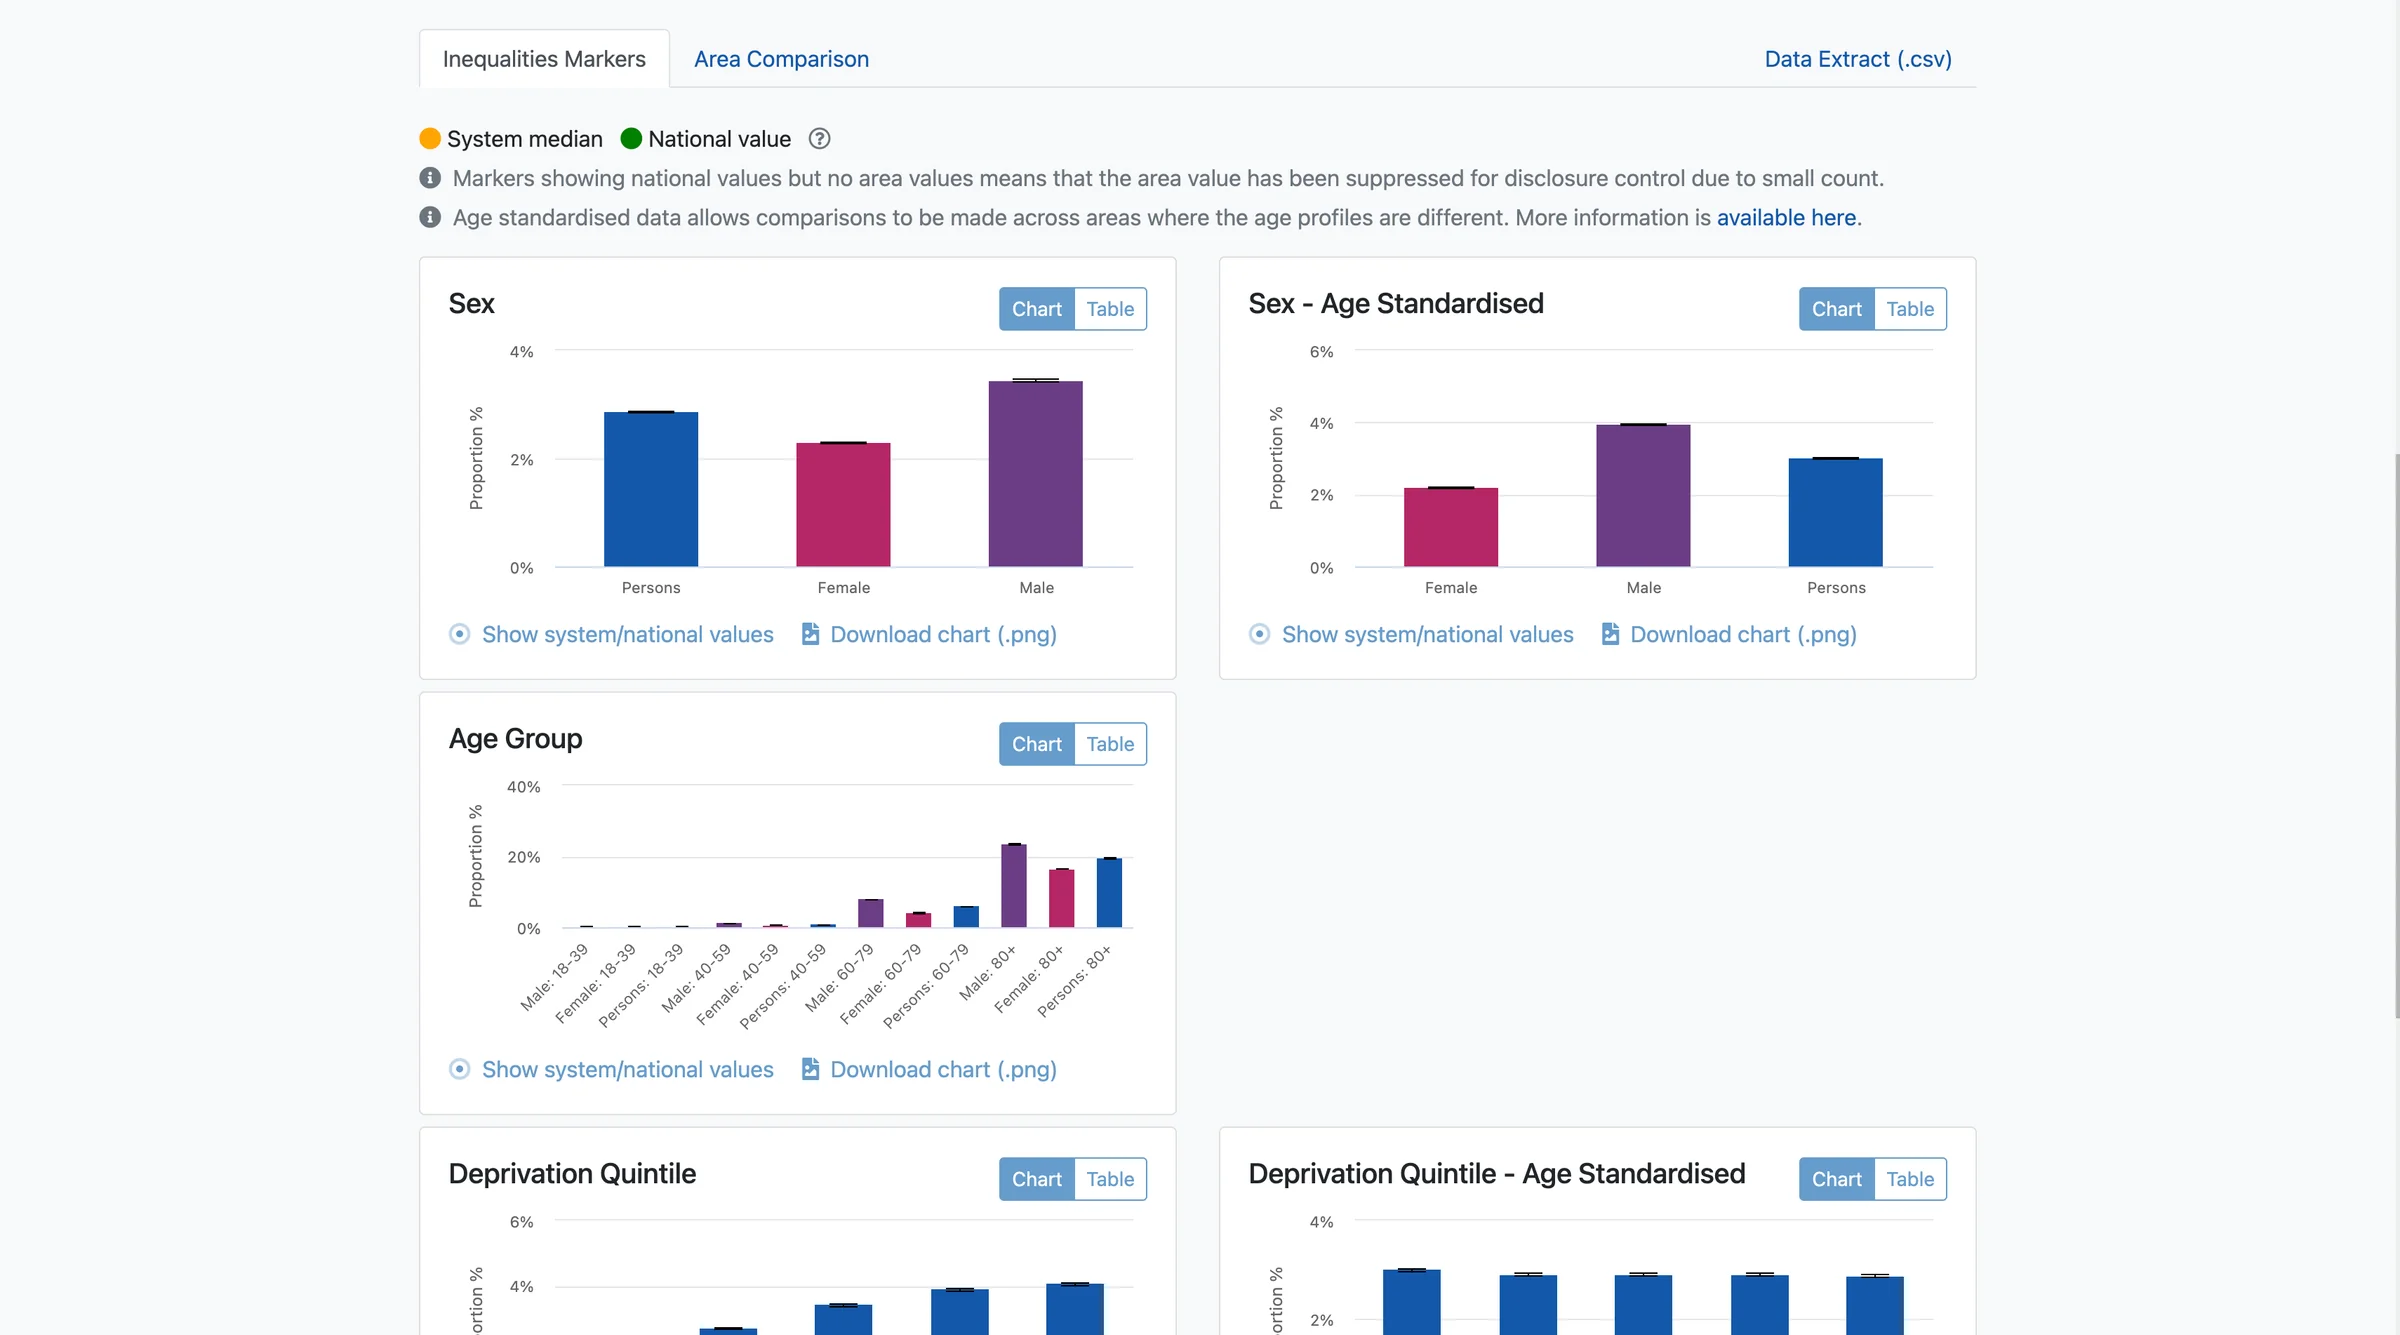
The platform supported exploration across multiple organisational and geographical levels, with filters for inequality markers, explanatory content and views designed to support quality improvement.
Despite the complexity and a highly compressed delivery schedule, we delivered the initial beta platform in approximately six weeks.
 (opens in a new tab)
The outcome
CVDPREVENT became a publicly available national data platform, providing an alternative to the original dashboard-led approach.
It brought together aggregated cardiovascular indicators in an interface intended for public, clinical and analytical audiences, with the ability to explore variation across geography and inequality measures.
The platform continued to be developed beyond the initial beta.
For me, this project demonstrates the value of combining product thinking with hands-on technical delivery: understanding the problem, shaping a solution with stakeholders, establishing a coherent visual language and building the working interface.
The work
- Product discovery and requirements development
- Stakeholder engagement and rapid prototyping
- Brand identity and UX design
- Data visualisation
- Complete Angular front-end development
- Collaboration on data presentation and integration